Quick Answer
If Google Chrome Helper (Renderer) is using a lot of memory on your Mac, open Chrome’s More (⋮) → More tools → Task Manager, sort by Memory, and identify the named task before stopping anything. Save work in the affected page first.
Check Activity Monitor → Memory → Memory Pressure as well. A large helper process alone does not establish a problem; look for sustained pressure, slowdowns or growth that repeats under the same workload.
Find the Tab or Extension Using Memory
Step 1: Identify the task in Chrome
Chrome Task Manager lists tasks such as pages, subframes and extensions. Record the task name and memory reading. If needed, right-click its column header and enable Process ID to compare the PID with Activity Monitor.
Treat the PID as a process identifier, not a one-to-one tab label: several tasks can share a renderer, and one tab can use several renderers. Memory figures in Chrome and Activity Monitor can also use different accounting, so they need not match exactly.
Step 2: Save work and change one thing
If the task belongs to a page you no longer need, save its contents and close that tab normally. For an extension, disable it in Extensions → Manage Extensions, then repeat the same activity.
Use End Process only when you intend to terminate that task. It may leave an affected tab showing an error rather than remove the tab. Tasks sharing the process may also be affected, and unsaved work can be lost.
Step 3: Compare the result
Keep the other tabs and apps as similar as possible. Watch the task’s reading and system memory pressure after the change, then repeat the original action if practical.
| Observation | What to investigate next |
|---|---|
| Pressure and responsiveness improve after closing a page | Reopen it alone and compare the same workload |
| Disabling an extension helps repeatedly | Keep it disabled while checking updates or alternatives |
| Memory stays high after closing one tab | Check shared processes, other tasks and background activity |
| Memory repeatedly grows during the same action | Record the pattern for further debugging; growth alone does not prove a leak |
What Is Google Chrome Helper (Renderer)?
Chrome separates browser work into processes. Renderers handle web content; GPU, network and other utility work can run in separate processes. Renderer is not a collective name for every helper type.
There is no fixed “one helper per tab” rule. A tab can contain frames in different renderer processes, while some tabs or frames share a renderer. Use task names and PIDs together instead of guessing from the number of Helper rows. The Chromium architecture documentation explains this distinction.
Reduce Recurring Memory Pressure
After identifying the workload, try the change that fits it:
- Close unused heavy pages and disable extensions you do not need.
- Review Settings → Performance → Memory Saver. Chrome can deactivate eligible inactive tabs and reload them when revisited; some activity keeps tabs active. Savings depend on your workload.
- Update Chrome and the affected extension, then repeat the same check.
- If a restart helps only briefly, record which action makes usage rise again.
There is no universal per-tab memory limit. For the difference between a busy Mac and a suspected leak, see memory pressure versus a memory leak.
When ProcXray Helps
Use Chrome Task Manager to find task names. Use ProcXray when you need to compare processes across browsers, inspect launch arguments, or watch resource history during a repeated action.
Arguments such as --type=renderer help identify a process subtype, but do not reliably provide its tab title, URL or extension identity. The Window Spy Picker identifies the app that owns a visible window; it does not resolve a browser window to an individual renderer.
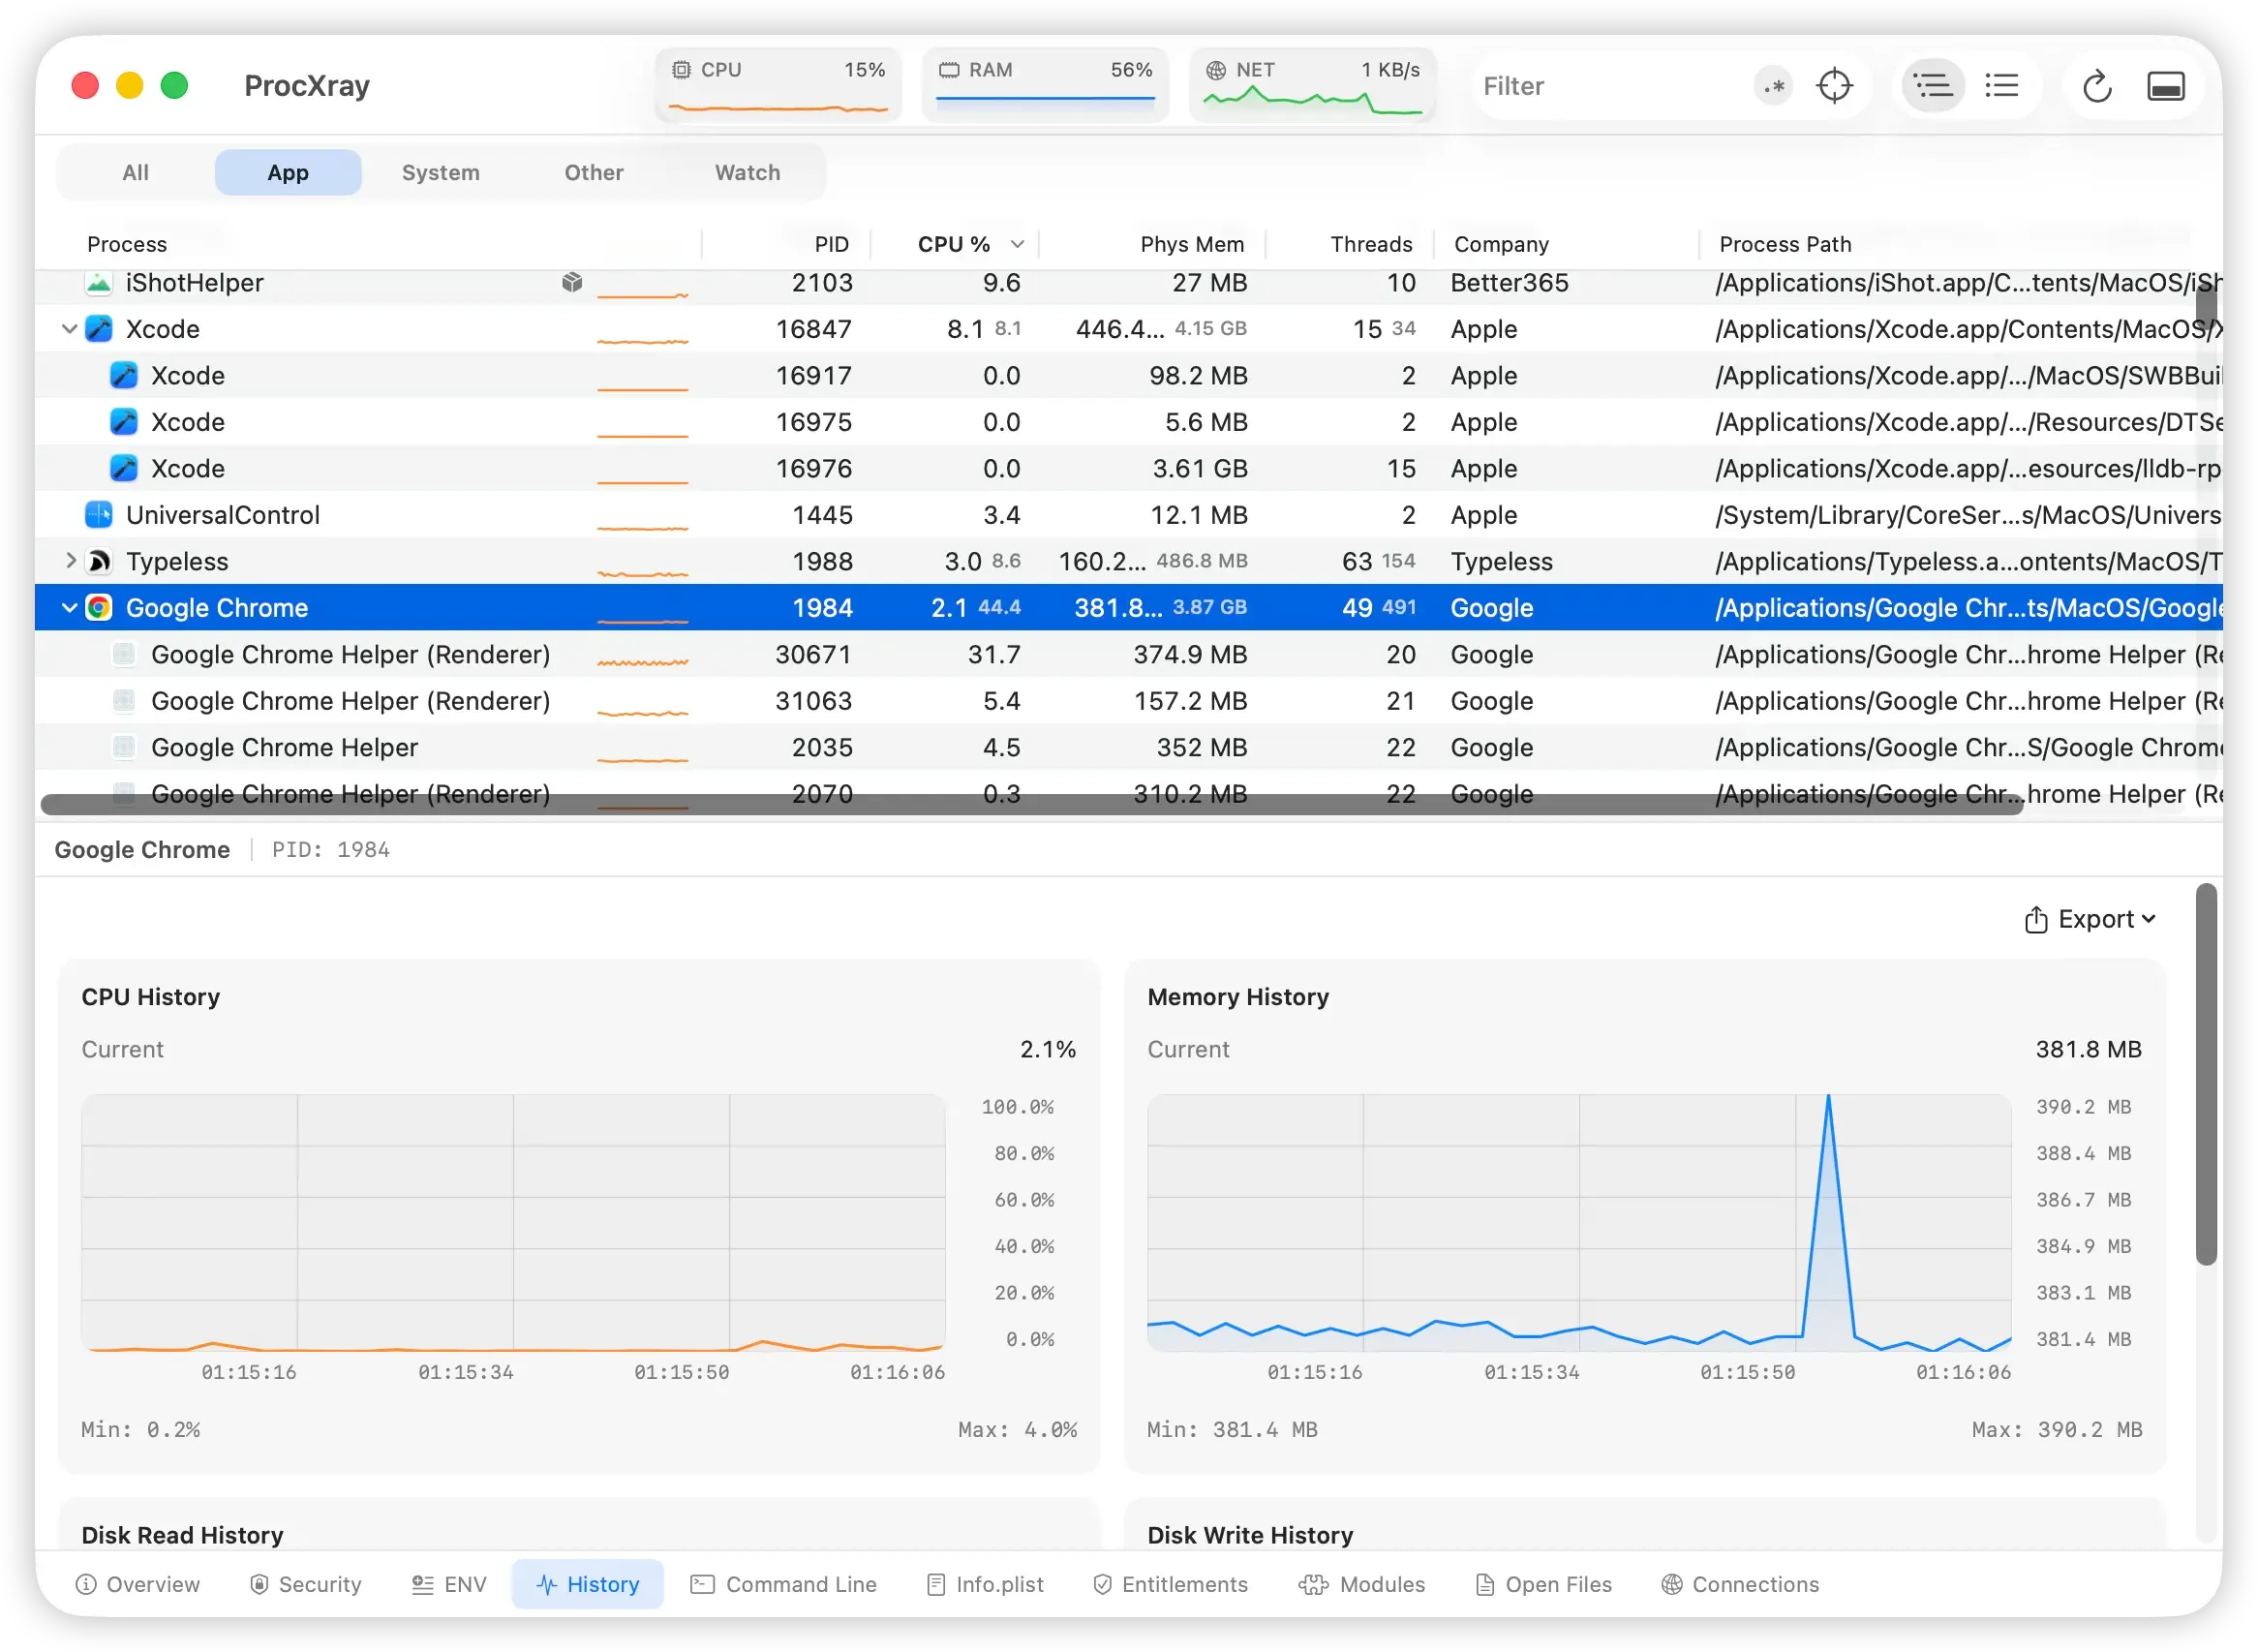
The selected row here is Google Chrome, PID 1984, not one of its renderer helpers. Its displayed memory briefly rises and returns near its earlier level. This existing screenshot illustrates a transient change, not a confirmed leak or a before-and-after fix.
Compare browser processes and inspect memory history with ProcXray →
Safari and Other Browsers
For Safari, start with Activity Monitor’s Memory tab and save work before closing suspect pages one at a time. Web Inspector can help examine a specific page in more detail. Do not assume Chrome’s task names, process allocation or menus apply to Safari.
For other Chromium browsers, check that browser’s task manager and documentation; menu paths and available columns can differ.
FAQ
Can I stop Google Chrome Helper safely?
Identify the task first and save work. Ending a renderer can interrupt one or more pages; ending another helper type can affect browser services. Closing an unwanted tab normally is preferable to terminating an unidentified helper.
Why does memory keep growing after I close tabs?
Other tasks may still use the process, or background work and caches may remain. Compare the same workload over time and check memory pressure. A graph can identify a pattern worth investigating, but confirming a leak needs further evidence.
Does Safari always use less memory than Chrome?
No result applies to every workload. Compare the same pages, extensions and activity on the same Mac, including responsiveness and memory pressure rather than a single process reading.
Related guides
- Distinguish memory pressure from a memory leak
- Investigate Mac heat and fan noise
- Check all running processes on your Mac